Clinical researchers at the Institute of Ophthalmology, University College London, UK, and Moorfields Eye Hospital NHS Foundation Trust, London, have presented a novel deep learning algorithm supporting data that “enables large-scale OCT feature quantification in IRD patients” providng phenotype correlations with demographic and genotypic parameters. The study measured eight features of interest defined in the work, covering retina, fovea, intraretinal cystic spaces (ICS), subretinal fluid (SRF), subretinal hyper-reflective material (SHRM), pigment epithelium detachment (PED), ellipsoid zone loss (EZ-loss) and retinal pigment epithelium loss (RPE-loss). Their results used OCT data from a large and heterogeneous cohort of 3,534 patients with molecularly confirmed IRDs, “to determine its performance, identify cross-sectional associations with demographic and genetic parameters, as well as quantify disease progression”. The identification and quantification of retinal disease-associated features within SD-OCT imaging can be critical for diagnosis, monitoring disease progression, providing prognostic information and assessing treatments in IRDs.
The AI algorithm (termed “AIRDetect”) automatically identified segment relevant features from SD-OCT images, providing a more detailed and comprehensive direct view of the 3D structure of the retina, compared to 2D FAF images. The basic results of the study showed that automatic segmentation was applied to 272,168 b-scans across 7,405 SD-OCT volumes encompassing 176 unique genes. Accounting for age, male patients exhibited significantly more EZ-loss (19.6mm2 vs 17.9mm2, p<2.8×10⁻⁴) and RPE-loss (7.79mm2 vs 6.15mm2, p<3.2×10⁻⁶) than females. RPE-loss was significantly higher in Asian patients than other ethnicities (9.37mm2 vs 7.29mm2, p<0.03). ICS average total volume was largest in RS1 (0.47mm3) and NR2E3 (0.25mm3), SRF in BEST1 (0.21mm3) and PED in EFEMP1 (0.34mm3). BEST1 and PROM1 showed significantly different patterns of EZ-loss (p<10−4) and RPE-loss (p<0.02) comparing the dominant to the recessive forms. Sectoral analysis revealed significantly increased EZ-loss in the inferior quadrant compared to superior quadrant for RHO (Δ=−0.414 mm2, p=0.036) and EYS (Δ=−0.908 mm2, p=1.5×10⁻⁴).
The researchers analysed the phenotypes of genes associated with both recessive and dominant inheritance patterns. In summary, in BEST1, there was higher ICS and SRF in the recessive forms of the condition which resulted in higher retina thickness. In PROM1 there was higher EZ- and RPE-loss overall in the recessive form, whereas in the dominant form EZ- and RPE-loss were limited to the centre. In RP1, the recessive form had higher EZ- and RPE-loss and a decreased retina thickness and, in GUCY2D, the dominant form had increased central EZ- and RPE-loss, compared to the recessive form observing a milder pathology and a thicker retina. Finally, in NR2E3, the dominant form had widespread EZ-loss and increased inferior RPE-loss, whereas the recessive form was milder (Figure 1 below):
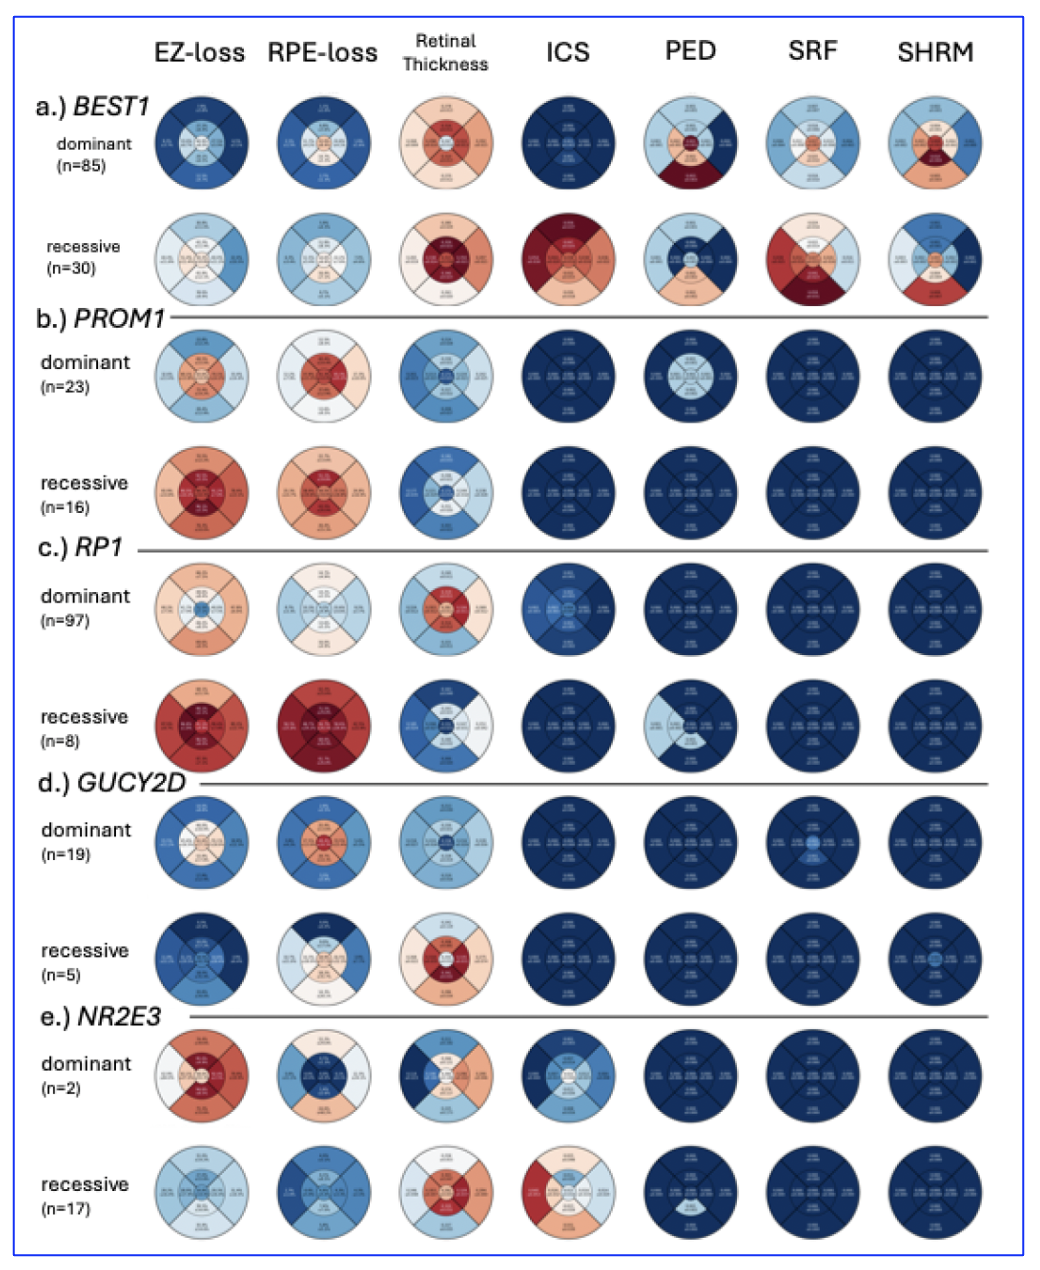
Figure 1: EDTRS region plots highlighting different phenotypes between dominant and recessive forms of disease for a.) BEST1, b.) PROM1, c.) RP1, d.) GUCY2D and e.) NR2E3. The recessive forms of disease are more severe for BEST1, PROM1 and RP1 and less severe for GUCY2D and NR2E3. [Open access content is authored by Woof et al., entitled, “Quantification of Optical Coherence Tomography Features in >3500 Patients with Inherited Retinal Disease Reveals Novel Genotype-Phenotype Associations”, as a medRxiv preprint doi: https://doi.org/10.1101/2025.07.03.25330767; this version posted July 3, 2025. The copyright holder for this preprint (which was not certified by peer review) is the author/funder who has granted medRxiv a license to display the preprint in perpetuity. It is made available under a CC-BY-NC 4.0 International license].